“You can’t improve what you don’t measure.”
With that in mind, we have worked on a dashboard to provide us with information about some useful and also useless cool things 🤷🏻♂️
The main idea was to have a generic system where data could be pushed and easily visualized.
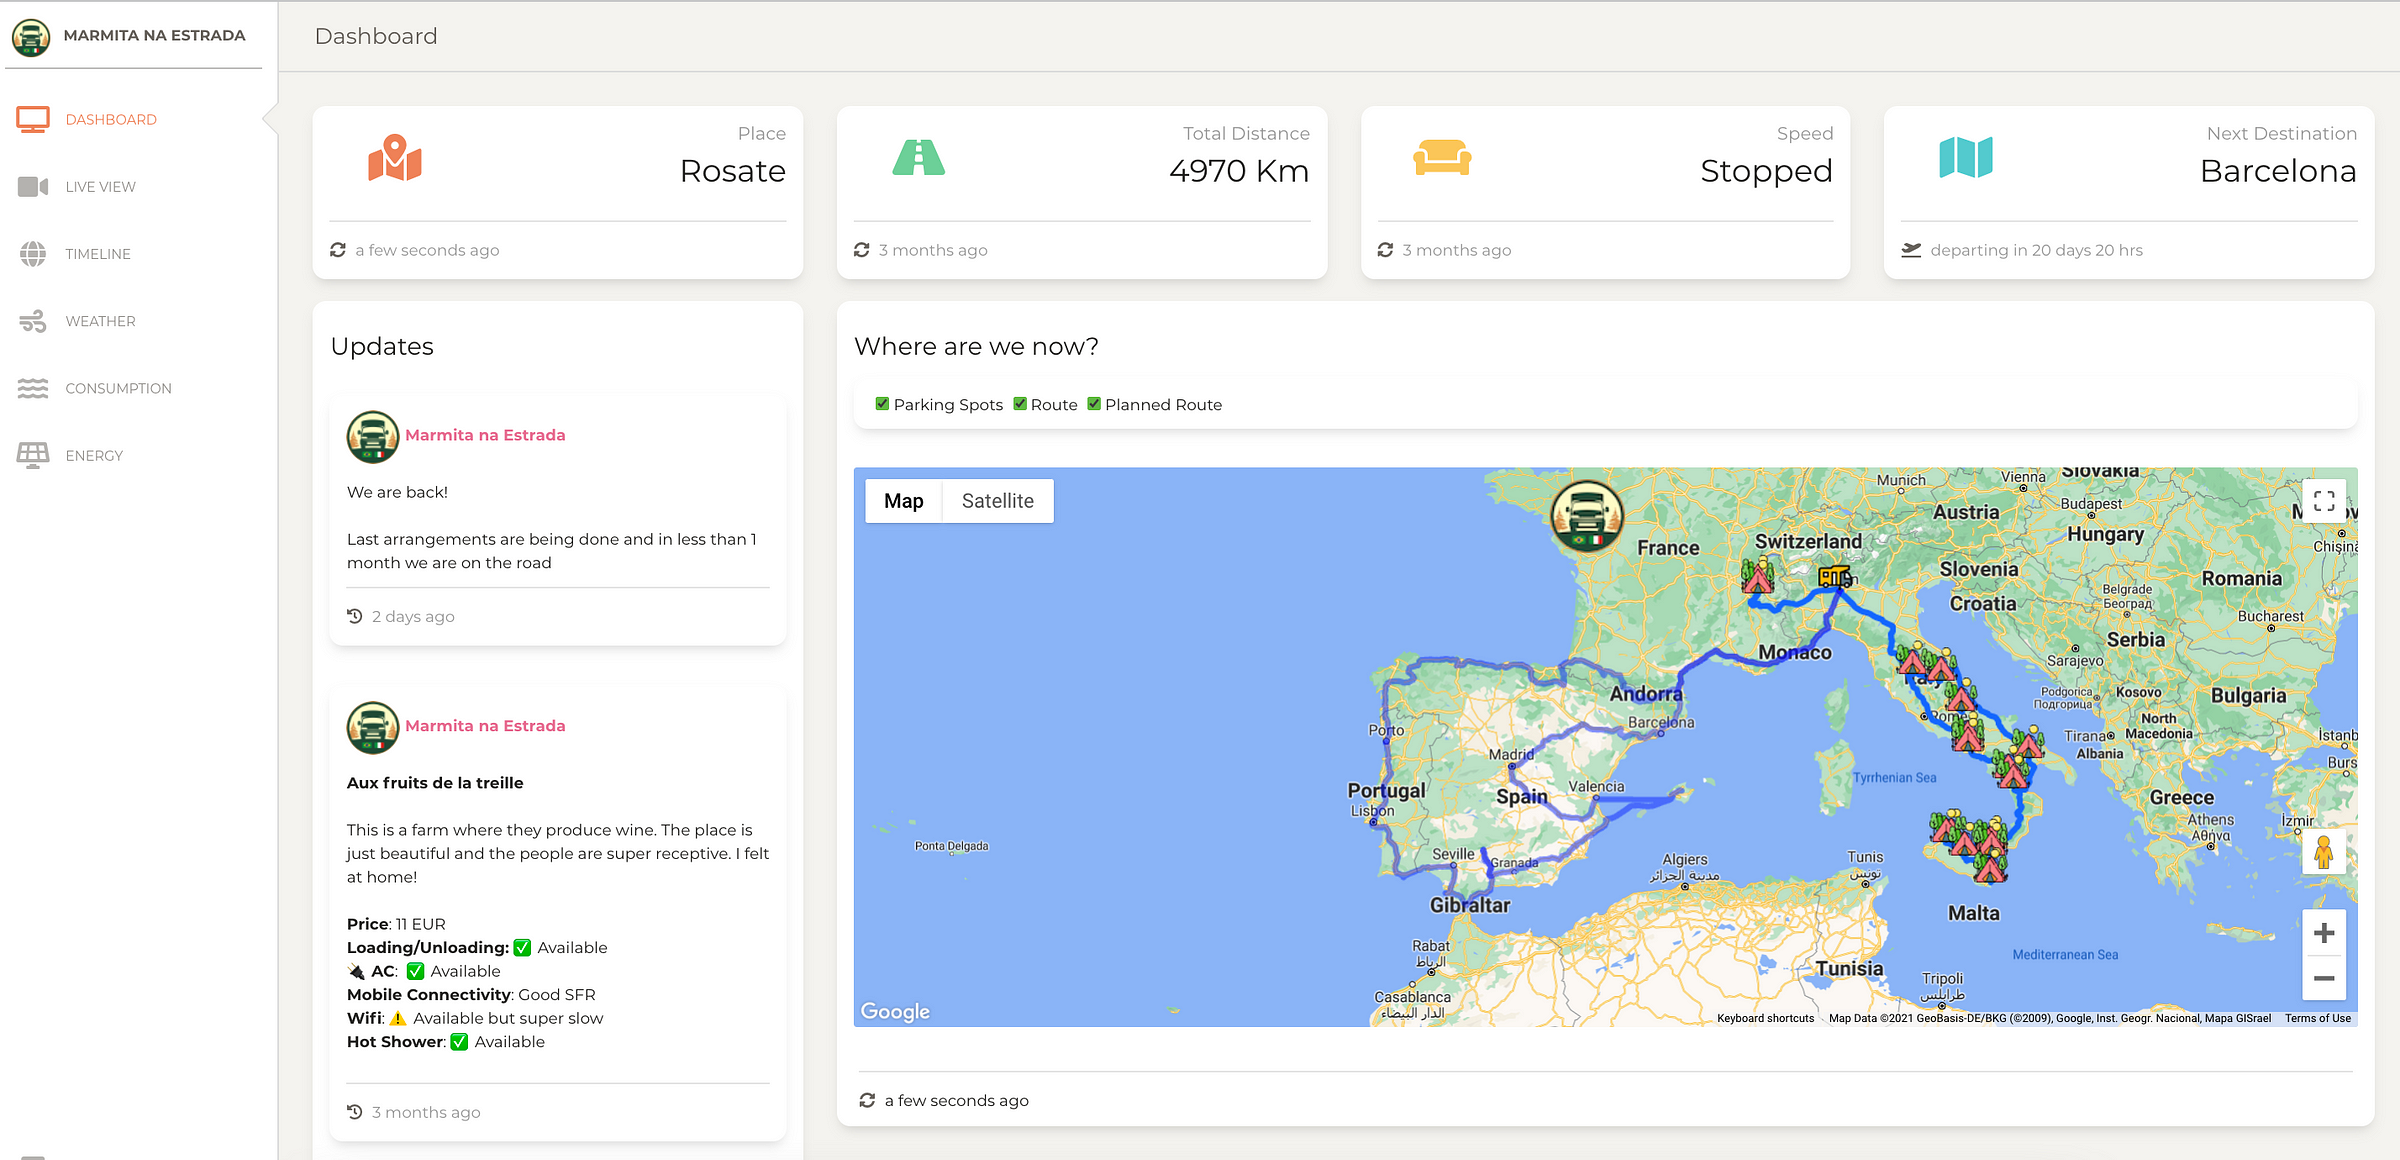
The first version of our dashboard looks like this.

As mentioned before there is useful data, like energy generation and consumption but also information like if we are stopped or moving, that in the end of the day is not super useful but, as an engineer 🤓, it still brings us joy
Overall Structure
The design is pretty simple and follows as described below:

Sensors: Sensors are connected to ESP32 boards that will collect, process and upload data to local getaway
VenusOS: This is a custom linux distribution developed and maintained by Victron Energy that will collect data from the solar system and make it available via MQTT
Rest Gateway: This is a gateway written in python that will make available some rest endpoints to store data locally that will be handled by a data uploader worker, also running locally. The reason why we are storing data locally first is that on the road we do not always have good data connectivity and we don’t want to lose so much data.
Data Uploader: This component also written in python will ensure that all the data stored in the local DB is safely saved on Firestore Database.
Once the data arrives in the Firestore database it is displayed in an Angular web dashboard.
If you want to check the Dashboad it is available here
Expanding the system
The next step will be adding a couple of other sensors.
- Water level
- Water flow
This will allow us to measure how much water we need.


